The Odds of Bankruptcy in Leveraged Trading
Leverage can be a trader’s best friend — or their worst enemy. A 5% move in a stock or token can turn into a 25% gain, but what happens when it doesn’t work in your favor? In this article, we delve into the dangers of leverage, examining the actual odds of liquidation at different levels of leverage across various assets and timeframes.
“Traders using 25X leverage have a 25%
chance of losing 100% of their money in 24 hours”
Everybody loves leverage when it works. That 5% move in a stock or token turns into 10%, 25%, or more. If this weren’t the case, why would crypto exchanges be offering 50x, 100x, or even an insane 250x leverage? (When I first saw 250x leverage advertised, I thought, why not 10,000x?) But what happens when the market moves against you? What happens when leverage works the way it was designed, but against you instead of for you?
To find out, I analyzed the probabilities of liquidation across different holding periods, trading strategies, and assets. The results were eye-opening.
. . .
The Reality of Liquidation
We all understand the risk: the market moves against you, your trade is liquidated, and you’re left watching from the sidelines as the market potentially rebounds. If you’re leveraging all your capital, your account can be wiped out in the process. But what are the actual probabilities of this happening?
Surprisingly, I couldn’t find any comprehensive studies on the probability of getting REKT with leveraged crypto trades. So, I decided to conduct one myself.
. . .
Using Bitcoin data from the past 8 years, I examined how often the price drops a given percentage from one day’s high to the next day’s low. However, this was too pessimistic, as we don’t always buy at the exact high (however much it can feel that way). So instead, I looked at price movements from one day’s close to the next day’s low for long positions (and from the close to the next day’s high for short positions). This gave an unbiased view — neither pessimistic nor optimistic about entry price.
Next, I extended the study to longer holding periods. As expected, the odds of liquidation increased with longer holding periods. Then, I analyzed a series of trades to see what happens when you employ leveraged short-duration trades multiple times as a strategy. Finally, I included Ethereum and Solana in the analysis, since people often trade these assets with leverage as well.
The general pattern will surprise no one. The more leverage you use, the higher the odds of liquidation. The longer the holding period, the greater the risk. However, what did surprise me was just how quickly the odds of liquidation increased as either leverage or holding period are extended.
. . .
Digging into the Numbers
Before we dive into the data, two important points:
- Liquidation Happens on Smaller Moves Than Expected: If you’re trading with 10x leverage, you don’t need a full 10% move to be liquidated — only about 8.5%. With 40x leverage, a mere 1.85% move can wipe you out. This margin of error exists to cover transaction costs and prevent slippage from causing losses that exceed your remaining capital.
- True Leverage Matters: The odds of liquidation only hold if you’re truly using the stated leverage across your entire account. If you have additional funds available to margin your position, your actual leverage is lower.
(I used BitMex’s formula for liquidation. This is not to pick on them. There is nothing particularly unfair about how they do it. But they are a major outlet for leveraged trading and the formula is public.)
So, let’s look at the data.
First, here is the overall risk of liquidation across all the data.

While the chart is helpful, we need to dig into the details.
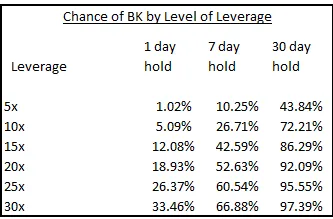
Looking across different holding periods
- Single-Day v. Longer Trades: For a single trade over a single day, high leverage is required to significantly increase the odds of liquidation. However, if you hold the trade longer, even moderate leverage leads to high liquidation odds. For example, 5x leverage over 30 days results in nearly a 50/50 chance of liquidation.
We can also look at the reverse. What amount of leverage is needed to reach any given bankruptcy odds?
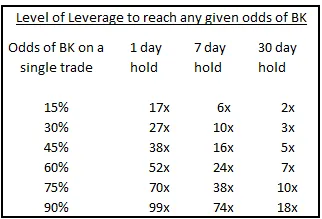
- Leverage vs. Bankruptcy Odds: To reach a 90% chance of liquidation, you need massive leverage — 99x for a single day. But over 30 days, only 18x leverage is needed.
. . .
The Dangerous Game of Repeated Trades
Few traders hold leveraged trades for a month, mainly because they get liquidated too quickly. However, the most common practice is executing a series of short-term, leveraged trades over time. When analyzing this strategy, the danger becomes clear:
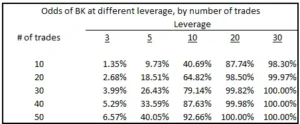
- Repeated Trades: The odds of avoiding liquidation remain above 90% at low leverage levels. But as leverage increases, even to 5x or 10x, the chance of being wiped out grows exponentially. At 50 trades, the odds of losing everything rise from likely to nearly certain once you exceed 5x leverage.
. . .
A Sucker’s Game?
We all knew leverage was risky, but the level of danger over time is extreme. With longer holding times or repeated trades, you’re very likely to lose all your trading capital. For the user, this is a sucker’s game. For the exchange, however, it’s clearly a winner, generating more commissions and higher volume out of your losing trades.
. . .
A Safer Approach with Outcome Trading
At Outcome Trading, we’re developing a better, safer way to do “leverage.” If you want to learn more, visit outcometrading.io.
. . .
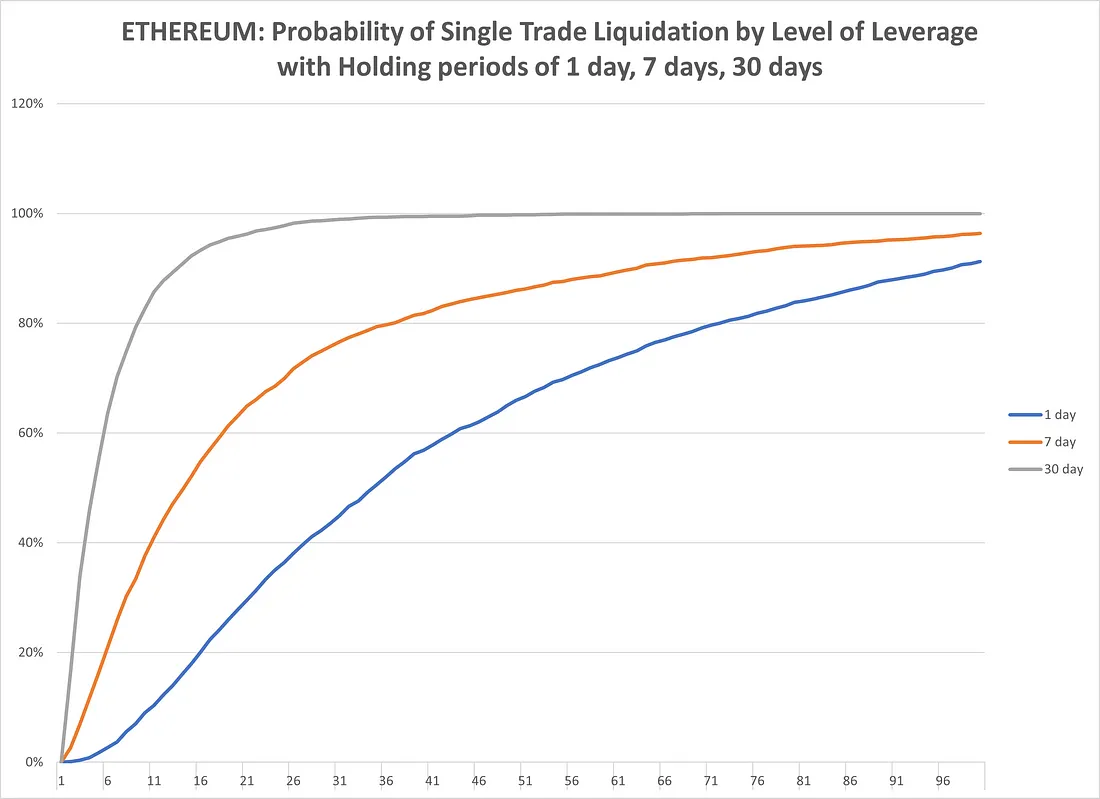
Addendum: Ethereum and Solana
As promised, here are the numbers for Ethereum and Solana. The pattern is the same but amplified. Volatility in these assets is higher, so the chances of being liquidated increase. You’re knocked out more quickly and at lower leverage.